
Men for Inclusion Lived Experience Survey - Ethnicity Differences
katie.robertson / 05 Sep 2023
Gary Ford - Co-Founder Men for Inclusion
How people from different ethnic backgrounds have different experiences in the workplace
The responses from people who described their ethnicity in terms that typically align to a group that has been traditionally underrepresented at work suggested that their workplace experiences are worse than those who identified with the more likely dominant workplace group (i.e. describing their ethnicity as white or similar). We will refer to the latter as the majority group in this article.
Of the 20 quantitative questions, the ethnic minority group answered more negatively to 14 of the questions, with 1 question answered more negatively by the majority ethnic group and the other 5 having relatively small differences. Of the 14, 2 had a greater than 20% differential between the groups and another 4 with a greater than 15% differential.
The 6 questions with a large differential were:
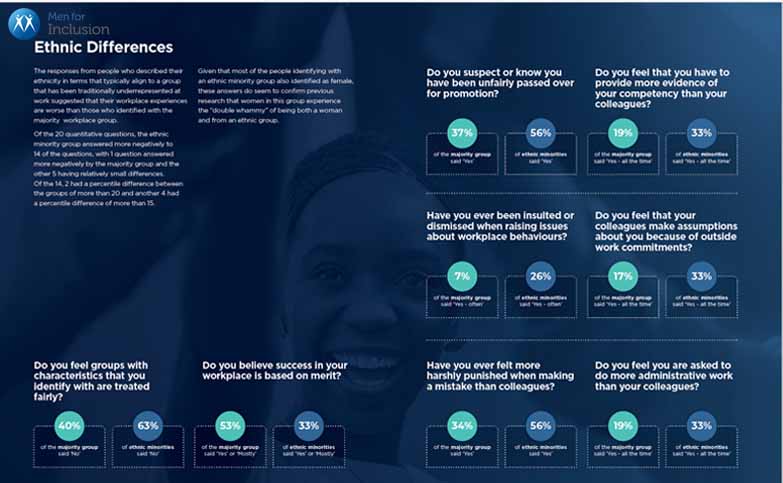
- “Do you believe that the groups that identify with the same characteristics as you (e.g. race, gender, etc.) are treated fairly in your workplace?” – 63% of the ethnic minority group said “No” versus 39% of the majority group.
- “Have you ever felt that you have been more harshly punished when making a mistake than your colleagues?” - 56% of the ethnic minority group said “Yes” versus 34% of the majority group
- “More broadly, do you believe that success in your organisation is based on merit? – 53% of the majority group said “Yes” or “Mostly” versus 33% of the ethnic minority group
- “Do you suspect or know that you have been unfairly passed over for promotion?” - 56% of the ethnic minority group said “Yes”, versus 37% of the majority group
- “Do you feel you have to provide more evidence of your competency than your colleagues?” – 33% of the ethnic minority group said “Yes – all the time” versus only 19% of the majority group.
- “Do you feel that your workplace has informal and formal social networks that are difficult for you to break in to?” - 49% of the ethnic minority group said “Yes” versus 33% of the majority group
Given that most of the people identifying with an ethnic minority group also identified as female, these answers do seem to confirm previous research that women in this group experience the “double whammy” of being both a woman and from an ethnic minority group.
As noted in previous blogs, the questions used in the survey are based on previous research outcomes showing how women, in particular, have their careers impacted by certain workplace behaviours. These answers do show that people from an ethnic minority group also experience a number of similar barriers, but how much of this is down to ethnicity rather than gender is harder to be sure about.
The questions above suggest that those from an ethnic minority group feel a greater sense of unfairness in the workplace and an even greater need to demonstrate competency in comparison to their colleagues from the majority ethnic group.
One stark difference is that the female v male results suggest limited impact of social networks on the employee experience, but when it comes to ethnicity, this becomes a key factor.
There are a few other areas where there are interesting (but smaller) differences based on ethnicity.
Only 31% of the ethnic minority group feel they can always bring their whole selves to work, versus 38% of the majority group and 100% of the ethnic minority group felt an inclusive workplace was essential or quite important to them, versus 95% of the majority group.
The ethnic minority group are also more likely to be insulted or dismissed when they raise issues about workplace behaviours. 26% of the group reported this as happening often, compared to only 7% of the majority group. 53% of the majority group reported this happening once or twice, versus 44% of the ethnic minority group. This would show that all groups are not being heard when raising these types of issues, but the majority group are having some success in getting their colleagues to take action, but for the ethnic minority group, this is much less likely.
Only 23% of the ethnic minority group felt that their performance was evaluated fairly by all of their managers, versus 34% of the majority group. In contrast, 18% of the majority group felt their performance was not evaluated fairly at all versus 12% of the ethnic minority group.
There was very little difference in the response “No” to the question “Do you think there is positive discrimination in your promotion process that favours those from under-represented groups?” (46% for the ethnic minority group versus 48% from the majority group). However, 18% of the ethnic minority group said “Yes” to this question versus 8% of the majority group, with the difference being more of the majority group saying “Sometimes” (26% versus 18%). This is another interesting finding which needs further discussion. This could reflect that the ethnic minority group are more open to bringing this important question into the open, whereas the majority group are potentially a little more hesitant in being quite so sure this could be happening.
On a similar basis, a negative response to the question “Do you feel that you are asked to do more administrative work that is not part of your core responsibilities than your colleagues?” was similar in both groups - i.e. 51% of the ethnic minority group responded “Yes - all the time” or “Sometimes” versus 49% of the majority group. However, there was a marked difference in the two answers themselves with 33% of the ethnic minority group saying this happened all the time, versus only 19% of the majority group.
There was also a similar response to “Do you feel that colleagues make assumptions about you, your work or your career because of outside work commitments?” with 54% of the ethnic minority group providing a negative response versus 50% of the majority group. The difference when looking just at the answer “Yes - all the time” was 33% for the ethnic minority group versus 17%.
There were no real differences in the responses between the groups when it comes to struggling to get your voice heard or more likely to be interrupted. There was a difference when it comes to ideas only being heard when repeated by someone else, with 64% of the ethnic minority group responding “Yes” or “Perhaps” versus 52% of the majority group. However, overall, this is suggesting that how the ethnic minority group are managing / being managed in group situations is slightly less of an issue than other exclusionary behaviours highlighted above.
The ethnic minority group did highlight a challenge with access to senior leadership with only 21% reporting that they frequently interacted with senior leadership versus 32% of the majority group. In contrast, 28% of the ethnic minority group responded that they don’t have access versus 13% of the majority group. Research has shown that issues with having access to social networks (as highlighted above for the ethnic minority group) can often impact this access to senior leadership. This research is around women, but it is highly likely this affects people from different ethnic backgrounds too.
The answer to the question “Has a work colleague ever suggested you owe your position / success to a particular personal characteristic (e.g. race, gender, etc.)” also provided an interesting result. The percentages responding “Yes - this happens to me all the time” and “Yes - once or twice) were close to identical. However, there were differences in the responses “No - never” (51% ethnic minority, 63% majority) and “No - but I have seen it happening to others” (18% versus 10%). There could be a number of explanations to this. First, the ethnic minority group may find this easier to spot when occurring to others rather than when it happens to themselves. Second, the person making this suggestion is more likely to vocalise this belief to a third party rather than suggesting it directly to the person they believe has benefited.
There was limited difference in response to “Do you feel that you get the same opportunities for career enhancing projects or activities as your colleagues?”
Finally, in a similar vein to the gender findings, there was a more positive response by the ethnic minority group to the question “Do you feel that you get direct and actionable feedback from your managers?” with 44% saying “Yes - frequently” versus 26% of the majority group. This may be managers make a clear effort to provide feedback to this group or it could be that managers may be less concerned about upsetting their ethnic minority colleagues than they are with colleagues from the same or similar ethnic group.
The top 3 career barriers for the ethnic minority group were “Lack of transparency about criteria for promotion” (6.72), “Not having access to the unwritten rules of how to get on” (6.05) and “Not fitting the mould of what a senior person looks like” (6.28). The average score was 5.51, higher than for women (5.13) and the highest for any demographic group where data was able to be collected.
Back to blog